Cyberbullying Classification
Cyberbullying is a form of online harassment that can have severe psychological and emotional effects on the victim. It can include posting hurtful messages, sharing private information, and making threatening comments.
Highlighting the topic of cyberbullying is essential because it raises awareness about this growing problem and its harmful impact on individuals and society.
This project explores data representations for building effective and impactful visualizations of data stories. By collecting and manipulating a large quantity of data, I have created a visualization that emphasizes the visual form and how it dialogues with its informational and cultural contexts. Given the complexity and size of the dataset, I have applied computational methods to create the visualization.

Dataset
As social media usage becomes increasingly prevalent in every age group, a vast majority of citizens rely on this essential medium for day-to-day communication. Cyberbullying can effectively impact anyone at any time or anywhere, and due to the anonymity of the internet, such attacks take place quite often.
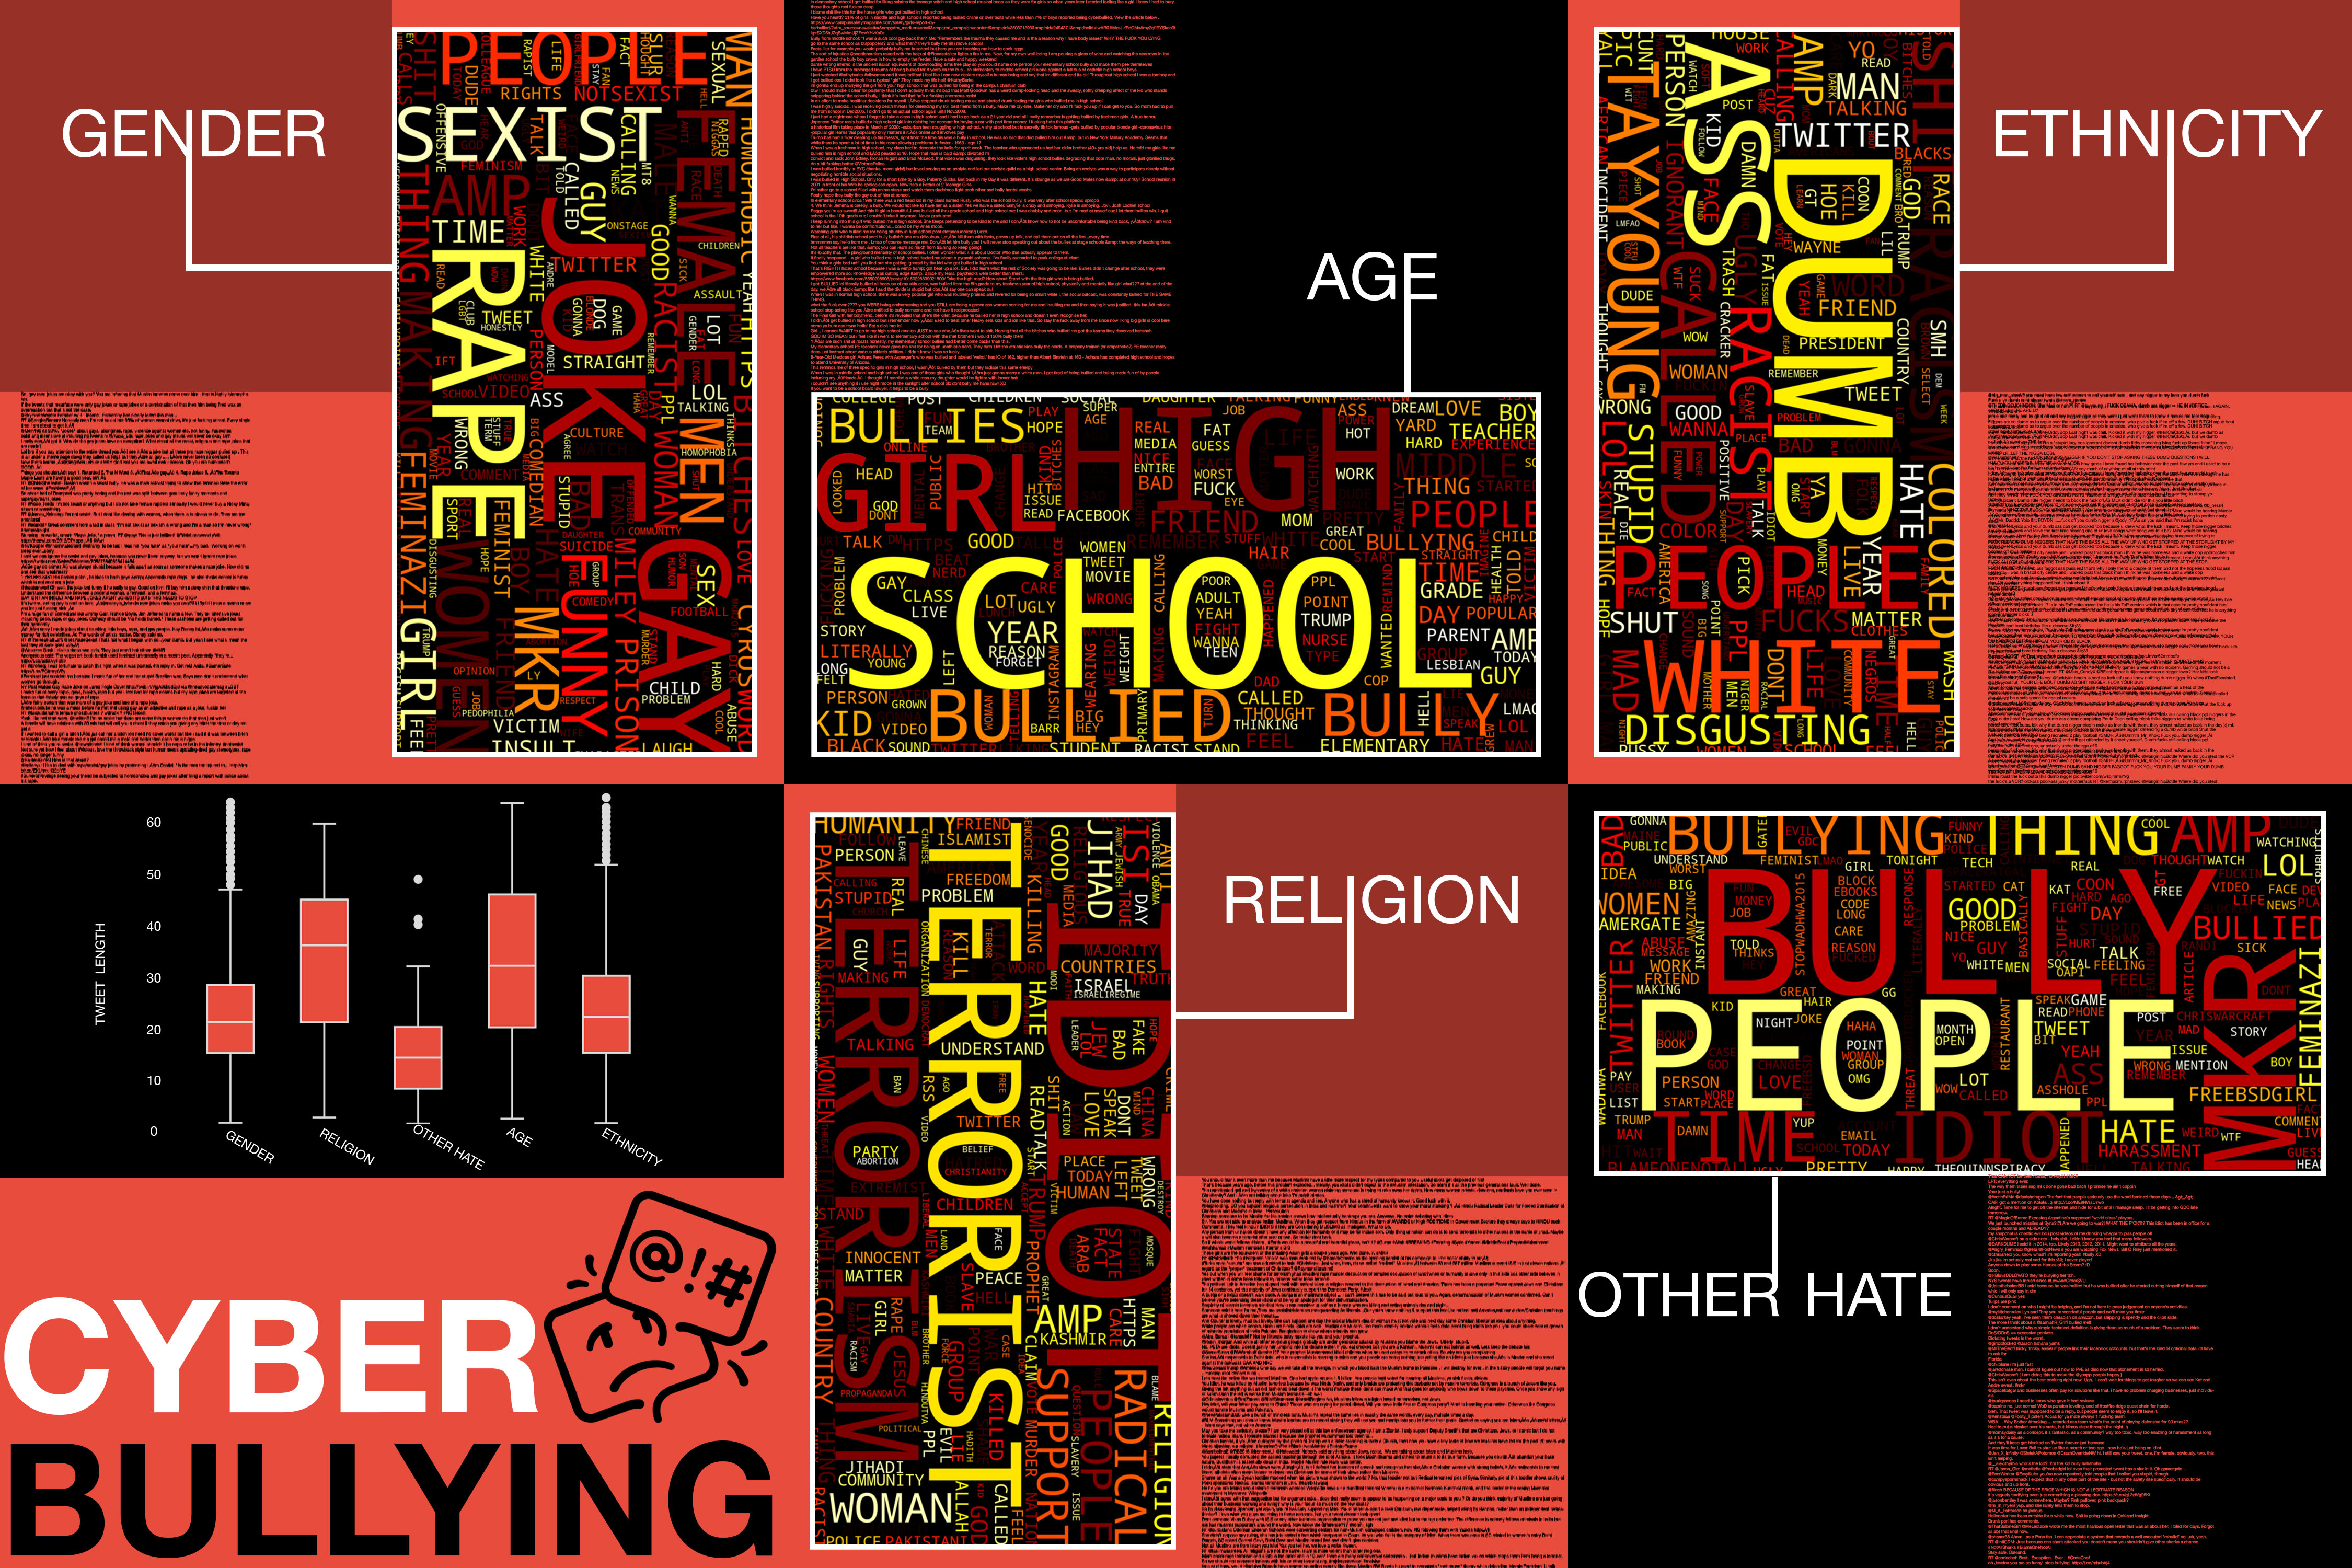
The dataset contains more than 47000 tweets labeled according to the class of cyberbullying: Age, Gender, Ethnicity, Religion, and other hate.
Source: Kaggle.com | Click here to download the CSV file
Stage One
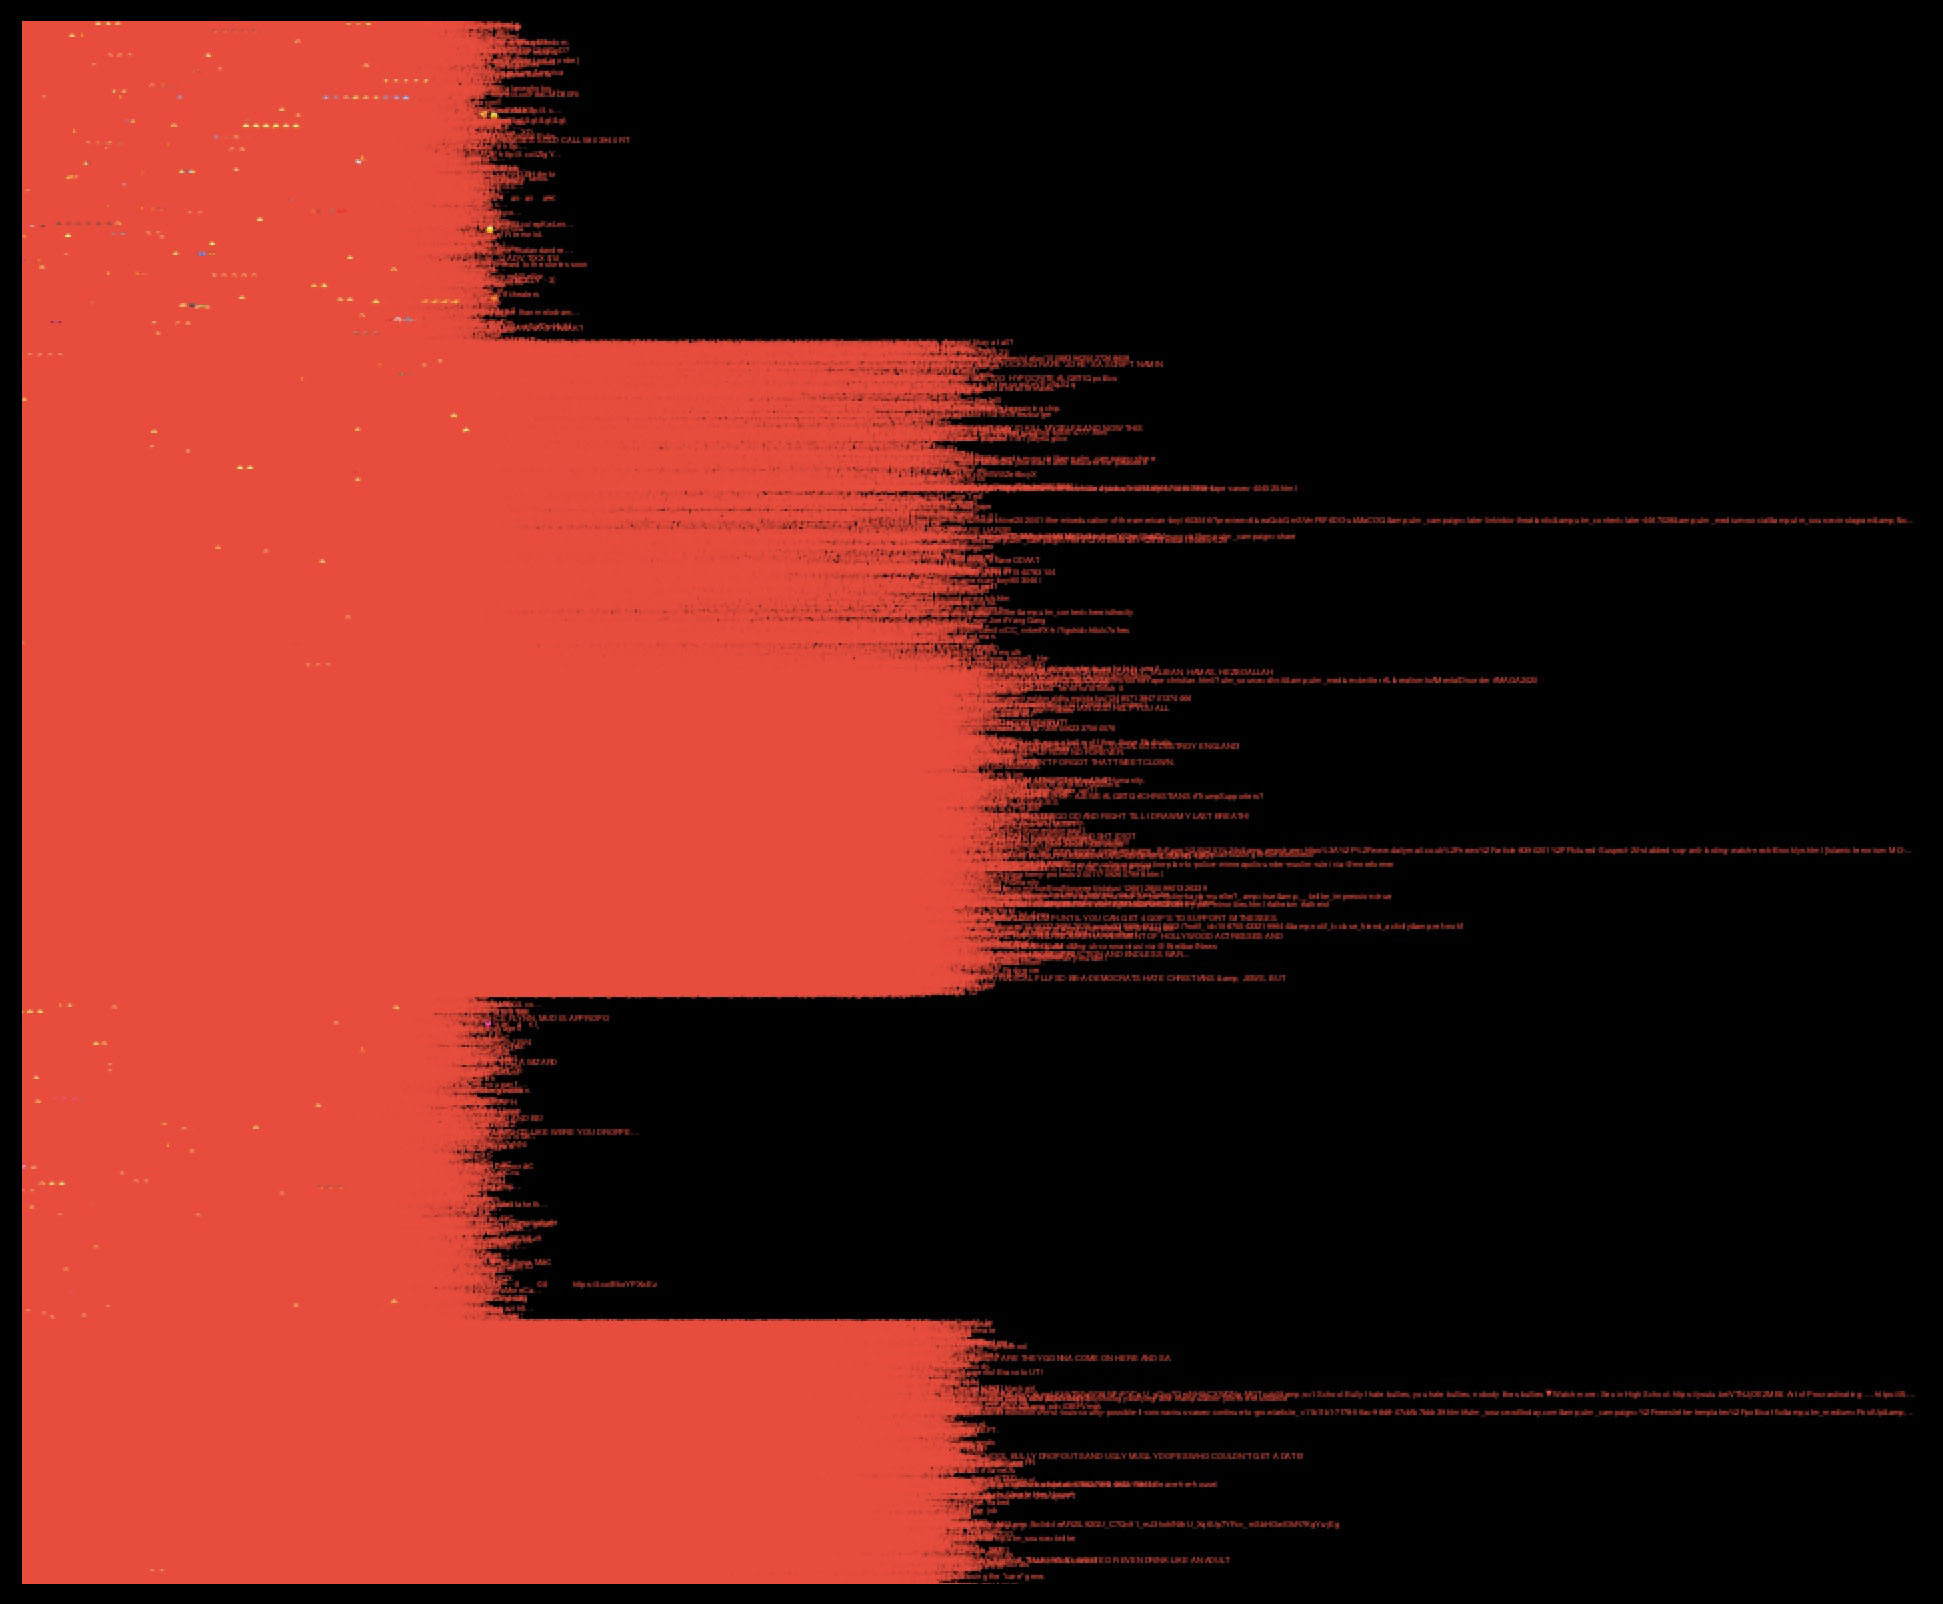
Using Processing tool I have mapped the dataset without aggregating any data. The idea was to have a straightforward, direct, visual dump of the data onto a static canvas and visualize it as an uninterrupted visual pattern.
Stage Two
This stage involved creating a static dashboard in a single panel that described the data. The iteration consists of wordclouds, boxplot, etc. with special attention given to the typography, layout, hierarchy, and color scheme.
Stage Three
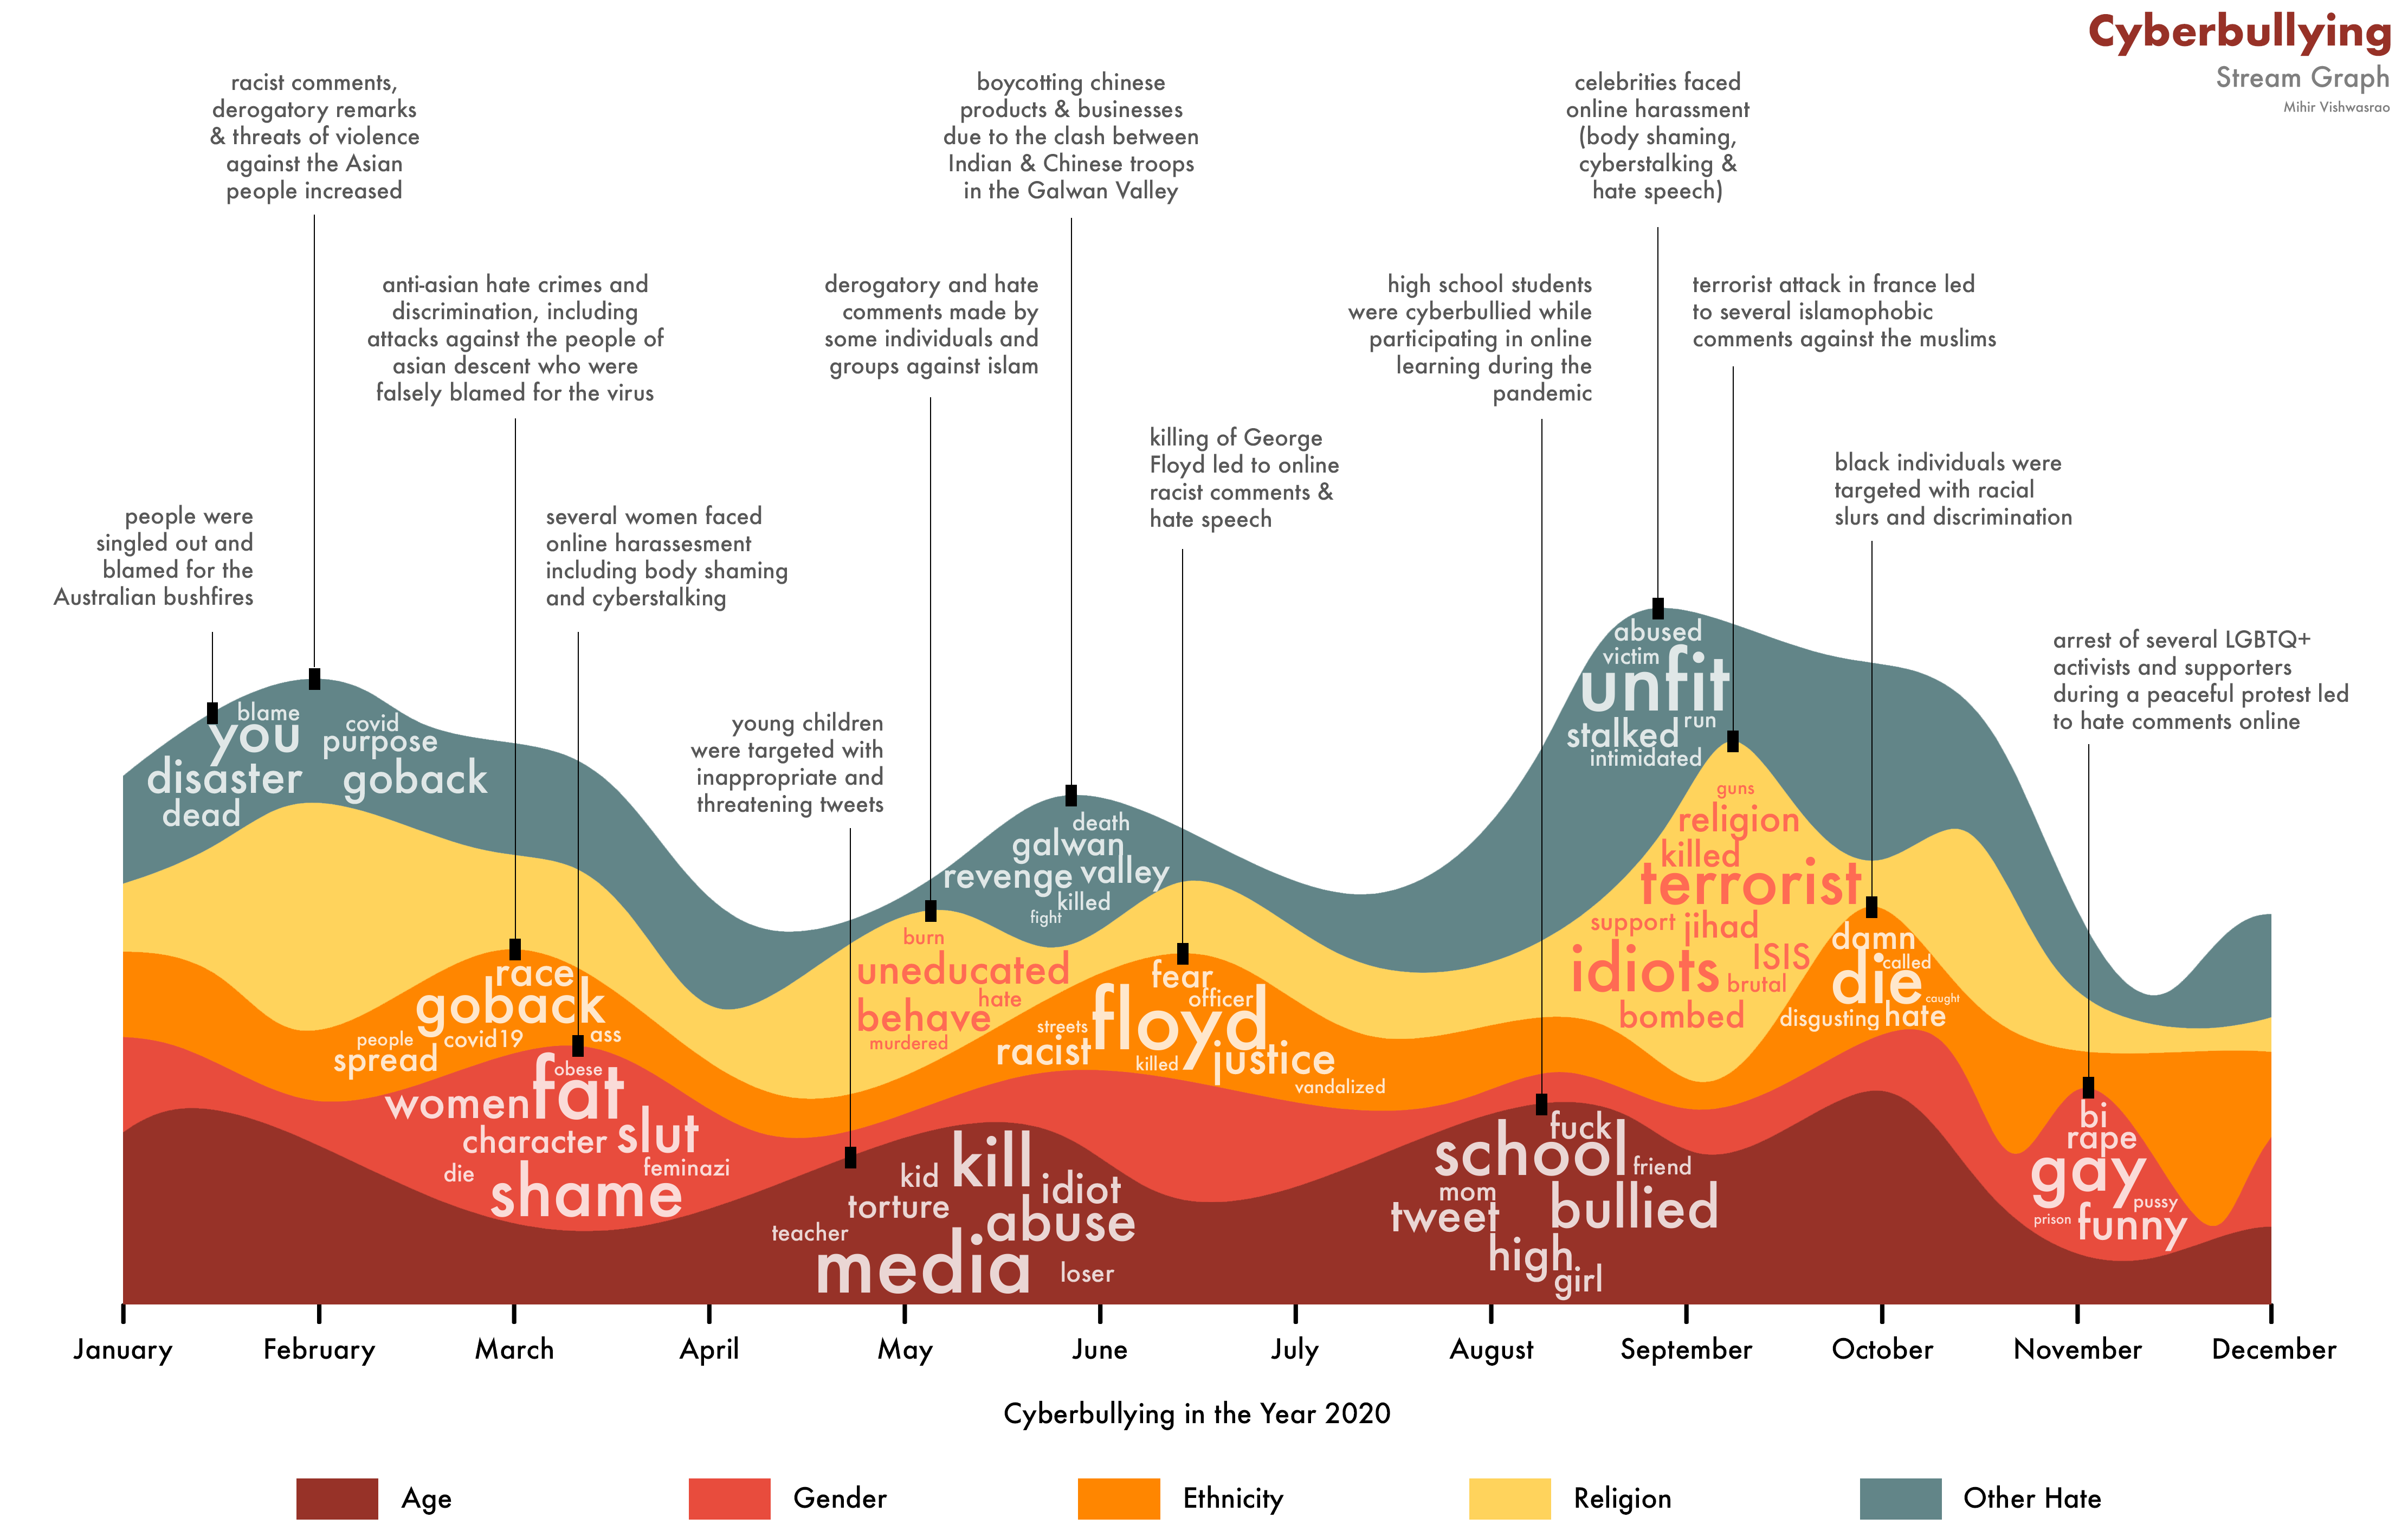
In the concluding phase, a singular static frame was crafted to distinctly convey the primary message concerning cyberbullying, ensuring clarity and explicit communication.
Disclaimer
This project includes visual representations, such as word clouds, generated from a dataset focused on cyberbullying that is sourced from Twitter. The content displayed may contain explicit language, and abusive expressions. The primary purpose is to illustrate the harsh realities faced by individuals and communities affected by online harassment. The intention is not to endorse or promote harmful language but to shed light on the importance of addressing online abuse.